

In this blog, we will talk about the 5 best free stock research tools for investing in 2025 . These tools are trusted , simple UI , easy to use , and help you learn stock investing step by step .
1. Yahoo Finance – Simple and Powerful Stock Research Tool
Yahoo Finance is a free website with simple layout and a mobile app , where you can check stock prices , charts , company financials , and news updates .
What Yahoo Finance Can do ?
-
Check Stock Prices in Real-Time – You can search for any company like Apple , Tesla or Amazon and see live stock prices .
-
Read News and Analysis – Yahoo Finance gives the latest updates about market trends , company earnings, mergers and more .
-
See Company Financials – You can check balance sheets , income statements and cash flow reports of companies , this helps you know how strong the business is .
-
Compare Stocks – You can compare two or more stocks to understand which one is performing better.
-
Create Watchlists – If you want to track your favorite stocks , you can add them to a personal list .
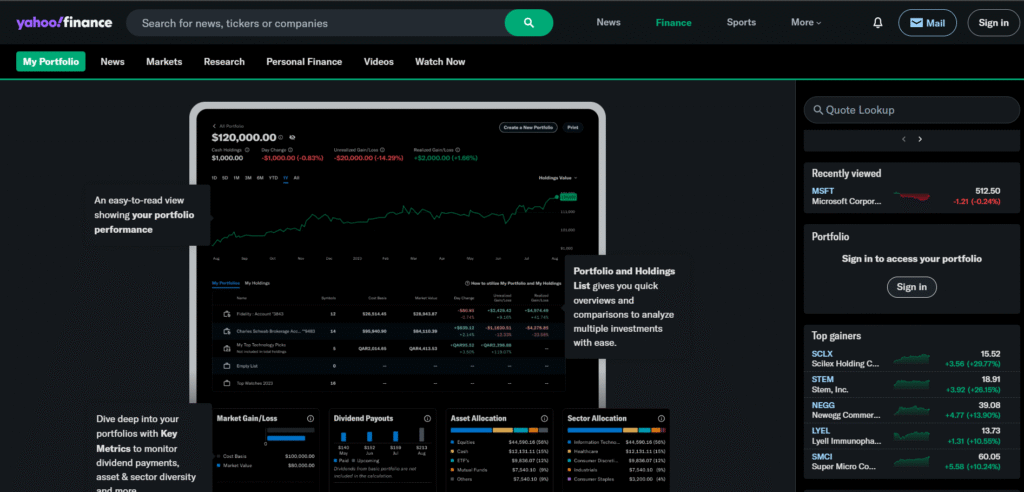
Yahoo Finance is one of the most widely used platforms for checking real-time stock data , news and financial trends .
2. TradingView – Best for Charts and Technical Analysis
TradingView is one of the most popular charting platforms used by traders and investors , free version offers many powerful tools that is enough for beginners to intermediate level trader or investor , You can access real-time charts for stocks , crypto , forex, and indices with indicators like RSI , MACD , fibonacci and moving averages .
In the free plan , you can use up to three indicators per chart , one chart per layout , and one saved layout at a time , ads are shown in the free version but dont’s block the main screen .
What Tradingview Can do ?
-
View Live Stock Charts – You can view its price chart in multiple time frames -1 minute , 1 day, 1 month etc.
-
Use Technical Indicators – You can access Tools like Moving Average, RSI , MACD , and Bollinger Bands .
-
Draw on Charts – You can draw trendlines , mark support and resistance levels and plan your entry / exit points .
-
Check Community – Many experienced traders share their analysis on TradingView, which you can follow .
-
Track Global Markets – You can also track crypto , forex , and indices like S&P 500 , NASDAQ and Dow Jones .
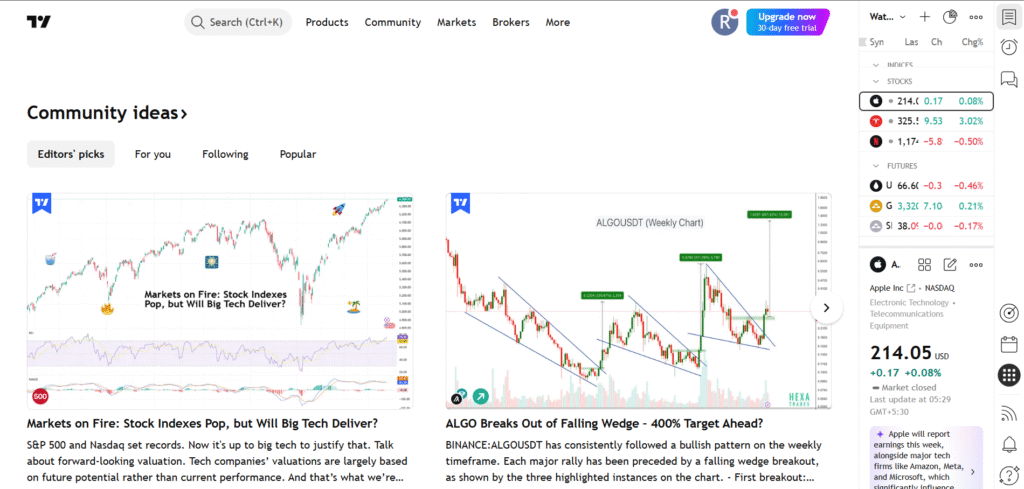
The free version of TradingView provides clean, interactive charts with essential technical indicators
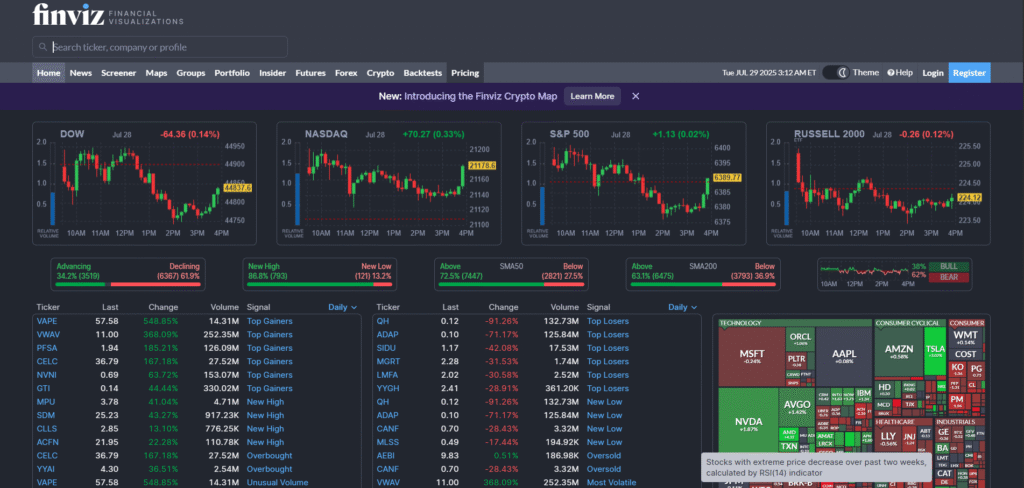
3. Finviz – Smart Tool for Stock Screening and News
“Financial Visualizations” is mostly used to screen stocks based on technical and fundamental filters . If you want to find high-growth or undervalued stocks quickly , Finviz is very helpful and will save your time .
What Finviz Can Do ?
-
Use Stock Screener – You can filter stocks based on market cap , dividend yield , P/E ratio, debt , price performance etc .
-
View Heat Maps – These give a visual idea of which sectors are doing well , for example , technology or healthcare .
-
Get Insider Trading Info – You can see if a company’s CEO or directors are buying or selling their own stock .
-
Check Stock News – Finviz give you latest updates about stocks .
-
Discover Top Movers – It helps you identify stocks that are gaining or falling .
It is especially useful for people who like to invest based on financial metrics .
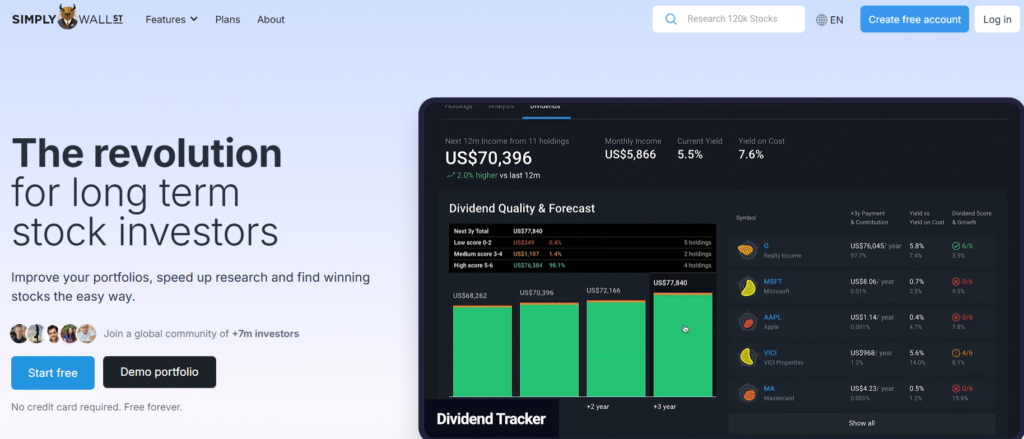
4. Simply Wall St – Visual Tool to Understand Company Fundamentals
This tool is best for beginners who don’t understand balance sheets or income statements like EPS , ROE or debt ratio , it shows everything using colors , shapes , and simple sentences , it also covers both U.S. and international stocks . The free version is best for beginner investors who want to learn about stocks without getting confused by many numbers . Platform also gives a “snowflake” graphic for every stock , which shows the company’s overall strengths and weaknesses .
What simply wall st Can Do ?
-
See Snowflake Reports – These visual reports show if a company is undervalued , financially healthy , and growing .
-
Check Company Valuation – It tells you whether the stock is trading below or above its fair value .
-
Dividend History – You can see if the company pays regular dividends , how strong it is , and whether it’s growing or not .
-
Risk Warnings – If a company has legal issues , debt problems or unstable earnings , Simply Wall St will highlight it .
-
Personalized Stock Ideas – Based on your investing style , it will suggest matching stocks .
Ideal for beginners who don’t understand balance sheets or income statements .
5. Ticker – Free Stock Research Tool Made for Investors
It gives access to institutional – quality data for free , you can track company earnings , compare performance, and analyze stocks in detail . It provides data about companies , including their market cap, P/E ratio , past performance and dividend history with simple interface .
What Ticker Can Do ?
-
Analyze Financials in Detail – You can get 10+ years of financial history including revenue, net profit , ROE , debt etc.
-
Read Earnings Transcripts – You can read what the CEO or CFO said in their quarterly results .
-
Do Peer Comparison – Compare a company with its competitors using key ratios and margins .
Stock Watchlists – You can track multiple companies and get updates when something changes .
Final Thoughts :
All the free stock research tools for investing mentioned above have their pros and corns , check according to your usage , Here’s a quick summary to help you choose :
-
Yahoo Finance – Great all-rounder for prices , news , and simple data .
-
TradingView – Best for chart lovers and technical traders .
-
Finviz – Ideal for filtering and scanning stock ideas .
-
Simply Wall St – Perfect for beginners who want visual explanations .
Ticker (TIKR) – Great for in-depth, professional-level analysis .
You can also check our blogs on :
Top 5 Ai tools For Trading in 2025 ?
Best Investing Books By warren Buffett ?
The Intelligent Investor By Benjamin Graham?